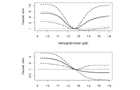
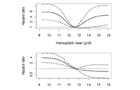
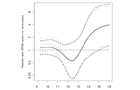
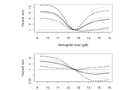
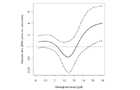
Adjusted hazard ratio for ESA users (top) and non-users (bottom) at various hemoglobin levels vs. a reference level of 12.5 g/dl. Gray: original analysis (excluding deaths up to day 90), black: analysis including deaths up to day 90.
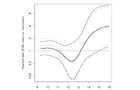
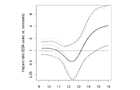
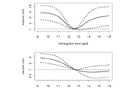
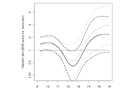
Adjusted hazard ratios of ESA users vs. non-users at various hemoglobin levels. Gray: original analysis (excluding deaths up to day 90), black: analysis including deaths up to day 90.
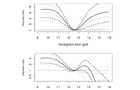
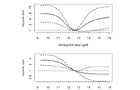
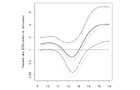
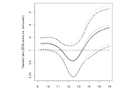
Adjusted hazard ratio for ESA users (top) and non-users (bottom) at various hemoglobin levels vs. a reference level of 12.5 g/dl. Gray: original analysis (multiple imputation; N=1794, 286 events), black: analysis using complete cases only (N=1386, 208 events).
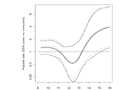
Adjusted hazard ratios of ESA users vs. non-users at various hemoglobin levels. Gray: original analysis (multiple imputation; N=1794, 286 events), black: analysis using complete cases only (N=1386, 208 events).
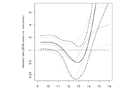
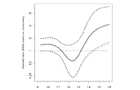
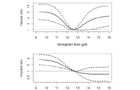
Adjusted hazard ratio for ESA users (top) and non-users (bottom) at various hemoglobin levels vs. a reference level of 12.5 g/dl. Gray: original analysis (multiple imputation; N=1794, 286 events), black: analysis after multiple imputation of artificially generated nonrandomly missing data.
Adjusted hazard ratios of ESA users vs. non-users at various hemoglobin levels. Gray: original analysis (multiple imputation; N=1794, 286 events), black: analysis after multiple imputation of artificially generated nonrandomly missing data.
Adjusted hazard ratio for ESA users (top) and non-users (bottom) at various hemoglobin levels vs. a reference level of 12.5 g/dl. Gray: original analysis (multiple imputation; N=1794, 286 events), black: analysis including time-dependent effects for cholesterol level and number of antihypertensive drugs.
Adjusted hazard ratios of ESA users vs. non-users at various hemoglobin levels. Gray: original analysis (multiple imputation; N=1794, 286 events), black: analysis after including time-dependent effects for cholesterol level and number of antihypertensive drugs.

Adjusted hazard ratio for ESA users (top) and non-users (bottom) at various hemoglobin levels vs. a reference level of 12.5 g/dl. Gray: original analysis (multiple imputation; N=1794, 286 events), black: analysis including nonlinear effects for cholesterol level.
Adjusted hazard ratios of ESA users vs. non-users at various hemoglobin levels. Gray: original analysis (multiple imputation; N=1794, 286 events), black: analysis after including nonlinear effects for cholesterol level.
Adjusted hazard ratio for ESA users (top) and non-users (bottom) at various hemoglobin levels vs. a reference level of 12.5 g/dl. Gray: original analysis (multiple imputation; N=1794, 286 events, follow-up until 31 Dec 2004), black: analysis including follow-up data until 31 Dec 2008 (313 events).
Adjusted hazard ratios of ESA users vs. non-users at various hemoglobin levels. Gray: original analysis (multiple imputation; N=1794, 286 events, follow-up until 31 Dec 2004), black: similar, but follow-up until 31 Dec 2008 (313 events)

Adjusted hazard ratio for ESA users (top) and non-users (bottom) at various hemoglobin levels vs. a reference level of 12.5 g/dl. Gray: original analysis (multiple imputation; N=1794, 286 events, follow-up until 31 Dec 2004), black: analysis excluding cardiovascular disease variables from final model.
Adjusted hazard ratios of ESA users vs. non-users at various hemoglobin levels. Gray: original analysis (multiple imputation; N=1794, 286 events, follow-up until 31 Dec 2004), black: analysis excluding cardiovascular disease variables
Adjusted hazard ratio for ESA users (top) and non-users (bottom) at various hemoglobin levels vs. a reference level of 12.5 g/dl. Gray: original analysis (multiple imputation; N=1794, 286 events, follow-up until 31 Dec 2004), black: analysis with ESA users left in ESA user group even after the time point where treatment is stopped.
Adjusted hazard ratios of ESA users vs. non-users at various hemoglobin levels. Gray: original analysis (multiple imputation; N=1794, 286 events, follow-up until 31 Dec 2004), black: analysis with ESA users left in ESA user group even after the time point where treatment is stopped.

Adjusted hazard ratio for ESA users (top) and non-users (bottom) at various hemoglobin levels vs. a reference level of 12.5 g/dl. Gray: original analysis of patient survival (multiple imputation; N=1794, 286 events, follow-up until 31 Dec 2004), black: analysis of transplant survival (graft loss and death counted as event; N=1794, 367 events).
Adjusted hazard ratios of ESA users vs. non-users at various hemoglobin levels. Gray: original analysis of patient survival (multiple imputation; N=1794, 286 events, follow-up until 31 Dec 2004), black: analysis of transplant survival (graft loss and death counted as event; N=1794, 367 events).
Adjusted hazard ratio for ESA users (top) and non-users (bottom) at various hemoglobin levels vs. a reference level of 12.5 g/dl. Gray: original analysis of patient survival (multiple imputation; N=1794, 286 events, follow-up until 31 Dec 2004), black: analysis additionally adjusting for primary indication for transplantation (diabetes, immune mediated, PCKD, or other).
Adjusted hazard ratios of ESA users vs. non-users at various hemoglobin levels. Gray: original analysis of patient survival (multiple imputation; N=1794, 286 events, follow-up until 31 Dec 2004), black: analysis additionally adjusting for primary indication for transplantation (diabetes, immune mediated, PCKD, or other).