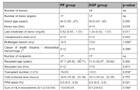
Demographic data of transplant donors and recipients stratified by treatment assignment. Continuous data are provided as median (1st quartile, 3rd quartile), categorical data are given as counts.
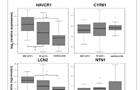
Box-Whisker-Plots of the four biomarkers in the tubulointerstitium. Boxplots show the median and the 1.5 interquartile range of the log2 (relative expression) measured in the qRT-PCR experiment. A value of zero equates same expression level like in the reference RNA.
Multivariable logistic regression model. The discriminative power of this model is indicated by a c-statistics of 0.83 (AUC). Given is the odds ratio (OR), the confidence interval, and the p-values.
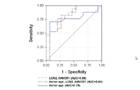
ROC curves: Discrimination for DGF after transplantation using donor age (solid blue line), expression features (dashed red line), or the combination of both (dashed green line).
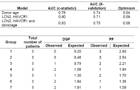
Discrimination of the models and optimism (3A) derived from the re-sampling procedure (34-fold cross validation). Calibration of the DGF prediction model by the Hosmer-Lemeshow goodness of fit test (3B). The expected to observed number of cases in each of the deciles of patients were not statistically different suggesting good calibration (p=0.76, chi-square test).
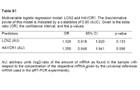
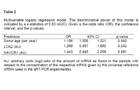
Multivariable logistic regression model: LCN2 and HAVCR1. The discriminative power of this model is indicated by a c-statistics of 0.80 (AUC). Given is the odds ratio (OR), the confidence interval, and the p-values.
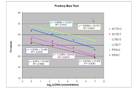
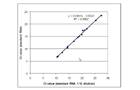
Bias Test of pre-amplification technique: Dilution series from a microdissected nephrectomy sample (T: Tubulointerstium, G: glomeruli part) were measured with qRT-PCR for ACTB (ß-actin), LCN2 (lipocalin 2) and PPIA (Cyclophilin A) after a 10 cycle pre-amplification. All regression lines show excellent correlation between a wide dynamic range (125ng/µl to 1ng/µl cDNA concentration before pre-amplification). The regression lines of PPIA and LCN2 show similar slopes, therefore we decided to use PPIA as endogenous control gene.
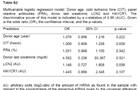
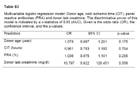
Multivariable logistic regression model: Donor age, cold ischemic time (CIT), panel reactive antibodies (PRA), donor last creatinine, LCN2 and HAVCR1. The discriminative power of this model is indicated by a c-statistics of 0.86 (AUC). Given is the odds ratio (OR), the confidence interval, and the p-values.
Bias test for reverse transcription, pre-amplification and realtime PCR of the reference RNA: Correlation of fourteen different genes in the standard RNA (Stratagene Human reference RNA) is almost one, suggesting reference RNA is an excellent calibrator.
Multivariable logistic regression model: Donor age, cold ischemic time (CIT), panel reactive antibodies (PRA) and donor last creatinine. The discriminative power of this model is indicated by a c-statistics of 0.85 (AUC). Given is the odds ratio (OR), the confidence interval, and the p-values.