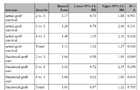
Cox-regression: complete-cases-only analyses
Analysis is adjusted for:
Number of antihypertensive drugs, cholesterol level, type of IS, year of TPL, MAP, donor age
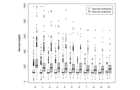
Glucose (medians/maxima per patient and year) (truncated at 1000 units).
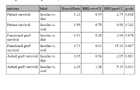
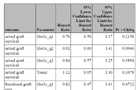
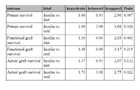
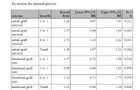
Complete-case-only analysis for Treatment comparison
a: Crude hazard ratios
b: Adjusted hazard ratios (multivariable Cox model; adjusted for number of antihypertensive drugs, peripheral vascular disease, cholesterol level, maximal glucose level, type of immunosuppression, year of transplantation, diabetes duration, donor age; 65 deaths, 65 graft losses).
c: Adjusted hazard ratio estimates from marginal structural Cox models; adjusted for number of antihypertensive drugs, peripheral vascular disease, cholesterol level, maximal glucose level, type of immunosuppression, year of transplantation, diabetes duration, donor age; 65 deaths, 65 graft losses).
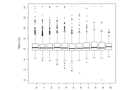
Hba1c (median per patient and year)
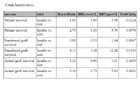
Crude hazard ratios for treatment comparison
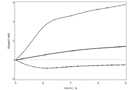
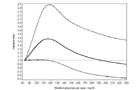
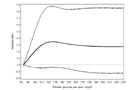
Nonlinear estimation of adjusted association of glucose control and mortality
Nonlinear estimation was performed using restricted cubic splines with knots placed at the 5th, 35th, 65th and 95th percentiles of the empirical distribution of each parameter (median glucose per year, HbA1c, maximal glucose per year).
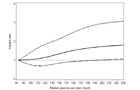
Patient survival
a: Neither mean glucose levels (mg/dl) nor mean HbA1c (%) predicted mortality. Solid line indicate the HR, dashed lines the 95%CI.
b:
c:
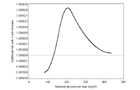
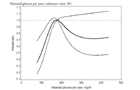
d: The slope of this curve reaches a maximum at 207, i. e. at 207 there is maximal additional risk due to increase of maximal glucose by 1 unit
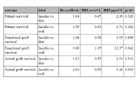
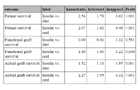
Adjusted hazard ratios for treatment comparison
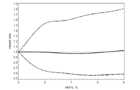

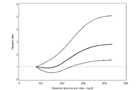
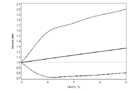
Nonlinear estimation of adjusted association of glucose control and mortality
Nonlinear estimation was performed using restricted cubic splines with knots placed at the 5th, 35th, 65th and 95th percentiles of the empirical distribution of each parameter (median glucose per year, HbA1c, maximal glucose per year).
Functional graft survival
a: Solid line indicate the HR, dashed lines the 95%CI.
b:
c: Maximal glucose per years, reference value 100
d: Maximal glucose per years, reference value 180
Assessment of model assumptions
a: Re-analysis for maximal glucose.
b: Re-analysis for HbA1c.
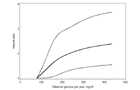
Nonlinear estimation of adjusted association of glucose control and mortality
Nonlinear estimation was performed using restricted cubic splines with knots placed at the 5th, 35th, 65th and 95th percentiles of the empirical distribution of each parameter (median glucose per year, HbA1c, maximal glucose per year).
Actual graft survival
a: Solid line indicate the HR, dashed lines the 95%CI.
b:
c: Maximal glucose per years, reference value 100