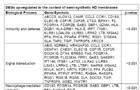
Representation of differentially expressed genes involved in a significant biological process, pathway or molecular function according to PANTHER ontologies when comparing semi-synthetic and full-synthetic membranes. The biological processes are ranked by p-value (as given by a chi-square test including Bonferroni correction when comparing the number of genes associated to the category with the total number of genes belonging to this particular pathway).
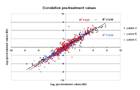
Correlation of the differential gene expression values of 299 features showing a fold change > 2 after hemodialysis derived from PBMCs harvested before HD. Given are the expression values before using semi-synthetic membranes (M1), plotted against expression values before using full-synthetic membranes (M2). Patient-specific correlation ranges in between 0.88 and 0.96.
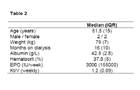
Demographic data of HD patients. Data are represented as counts or median and interquartile range (IQR).
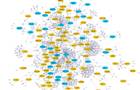
a: Protein-protein interaction network derived on the basis of differentially expressed genes when comparing semi- and full-synthetic membranes, additionally including interacting proteins as determined by the next neighbour expansion. Orange nodes (110 DEGs) indicate up-regulated genes afflicted with the semi-synthetic membrane, and blue nodes (49 DEGs) indicate features up-regulated in the context of full-synthetic membranes. Gray nodes represent proteins identified by the nearest neighbour expansion method on the basis of protein interactions represented in OPHID.
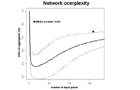
b: The index of aggregation (IA; y-axis) in dependence of the number of proteins used for constructing protein interaction networks (x-axis). The IA of DEGs is significantly above the IA of randomly selected lists. The thick black line represents mean IAs of randomly selected gene lists. Dotted lines represent the double standard deviations of these distributions.