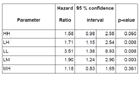
Association of hemoglobin variability group with mortality in an unadjusted Cox model (reference group MM).
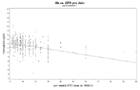
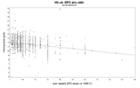
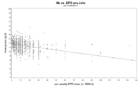
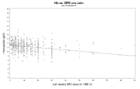
Hemoglobin values of patients vs administered ESA dose for each year during followup time
a: first year of treatment
b: second year of treatment
c: third year of treatment
d: fourth year of treatment
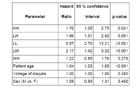
Association of hemoglobin variability group with mortality. Cox model is adjusted by age, vintage of dialysis, and sex.
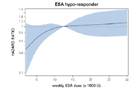
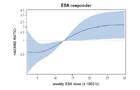
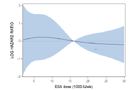
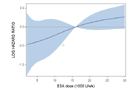
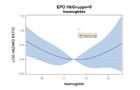
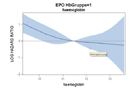
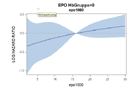
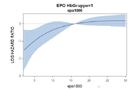
Hazard ratio of ESA dose levels (reference value 12500 U/week)
a: ESA hypo-responder
b: ESA responder
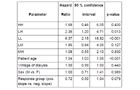
Association of hemoglobin variability group with mortality. Cox model is adjusted by age, vintage of dialysis, sex, and ESA response group.
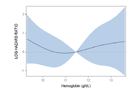
Dependency of hazard ratio of achieved hemoglobin levels for patients with baseline hemoglobin corresponding to
a: group L
b: group M
c: group H
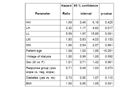
Association of hemoglobin variability group with mortality. Cox model is adjusted by age, vintage of dialysis, sex, ESA response group, diabetes, and BMI. Missing BMI values were imputed by mulitple imputation through linear regression.
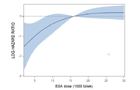
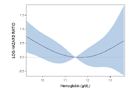
Dependency of hazard ratio of ESA dose levels for patients with baseline hemoglobin corresponding to
a: group L
b: group M
c: group H
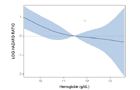
Dependency of hazard ratio of ESA dose levels for patients with
a: baseline hemoglobin ≤ 12 g/dl
b: baseline hemoglobin > 12 g/dl
Dependency of hazard ratio of ESA dose levels for patients with
a: baseline hemoglobin ≤ 12 g/dl
b: baseline hemoglobin > 12 g/dl
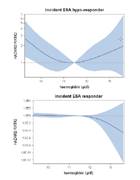
Hazard ratio for haemoglobin levels of incident patients stratified in groups of ESA responsiveness.
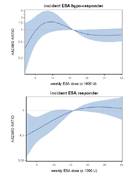
Hazard ratio for ESA dose of incident patients stratified in groups of ESA responsiveness.
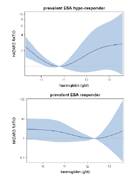
Hazard ratio for haemoglobin levels of prevalent patients stratified in groups of ESA responsiveness.
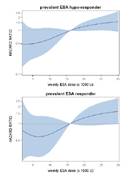
Hazard ratio for ESA dose of prevalent patients stratified in groups of ESA responsiveness.