Differentially expressed genes (DEGs)
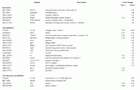
List of 234 differentially regulated genes (>1.5 fold) in PHN induced rats on day three and or day six. Genes are annotated with NCBI Gene Symbols and grouped according to biological function. Starred (*) Gene Symbols mark predicted genes.
Proteinuria
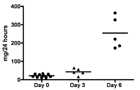
Graph in figure 1 is showing total protein excretion of rats at the baseline (day 0) and after induction of disease (day 3 and day 6).
List of over- and underrepresented ontology terms in the dataset
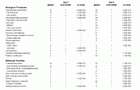
List of genes assigned to the over- or under-represented GO terms. Genes in the list are sorted according their cellular function. Significance levels are given as Bonferroni corrected p-values (p<0.005) following a chi-square test.
Enriched biological processes
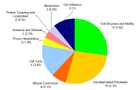
Enriched biological processes and number of differentially expressed genes are
given in figure 2. Numbers in brackets depict expected gene numbers according to
the background distribution of all human genes.
Protein interaction modules
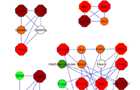
Graphical visualization of the top four network modules. Node fill colour indicates the
measured fold-change, where green represents down regulated genes (light green <
-1.5, dark green < -2) and red represents upregulated genes (orange <1.5, red >1.5,
dark red >2). The nodes border colour indicates the subcellular localization of the
protein (yellow for membrane and blue for extra cellular). Hexagon shape of the node
represents DEGs and circular shape represents direct interacting proteins.
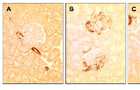
SM22 levels in PHN
(A) Staining for SM22 is absent in control glomeruli, but is detected in the blood
vessels. (B) SM22 staining is detected in the glomerulus at day 3 of PHN, in a
podocyte distribution. (C) SM22 staining is markedly increased at day 6 of PHN in
podocytes. Staining was absent when the primary antibody was omitted (not shown).

Heatmap showing expression levels of the 234 differentially expressed genes
Horizontal rows represent the expression levels of the 234 DEGs sorted by fold-change when comparing controls and treated animals. Arrays were clustered using average linkage distance and the Pearson correlation coefficient in the clustering algorithm. Gene Symbols marked with an asterisk depict predicted genes. Grey bars indicate non-significant expression changes.