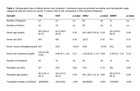
Demographic data of kidney donors and recipients. Continuous data are provided as median and interquartile range, categorical data are shown as counts. P-values refer to the comparison to PBx (protocol biopsies).
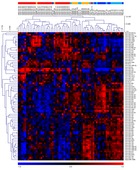
Unsupervised clustering of miRNAs with high variance (top 20 %, 80 miRNAs), red - acute cellular rejection (AREJ), orange - antibody mediated rejection (ABMR), light blue - DGF, blue - protocol biopsies (PBx). The heatmap was produced using clustering of rows (miRNA expression values) and columns (samples) of the data matrix using complete linkage algorithm and Pearson correlation. The miRNA clustering tree is shown on the left and the smaple clustering tree is shown on the top. The sampels are clustering broadly into two groups, rejection and no rejection. The color scale shown at the bottom illustrates the relative expression level of the indicated miRNA across all samples: red enotes expression > 0 and blue denotes an expression ≤ 0.
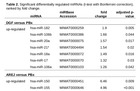
Significant differentially regulated miRNAs (t-test with Bonferrroni correction), ranked by fold change.
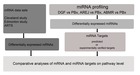
Schematic representation of our combinatorial approach for identifying miRNAs, miRNA targets, genes and molecular pathways in delayed graft function and acute rejection. Differentially expressed miRNAs were obtained by comparing delayed graft function (DGF), acute cellular rejection (AREJ), and antibody-mediated rejection (ABMR) compared to allografts with normal function (protocol biopsies (PBx)). miRNA target genes were predicted by DIANAmT, miRanda and Targetscan , and experimentally validated targets were identified by using miRTarBase . Post-transplant gene expression profiles were derived from the Cleveland study , and from Edmonton study . Acute rejection transcript set (ARTS) were obtained from analysis of independent gene expression dataset of renal allograft biopsies with acute rejection . Comparison of miRNA target lists and gene lists were performed to derive set of pathways core to acute rejection and delayed graft function.
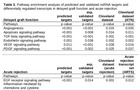
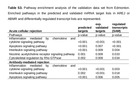
Pathway enrichment analysis of predicted and validated miRNA targets and differentially regulated transcripts in delayed graft function and acute rejection.
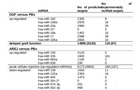
Number of predicted targets (DIANAmT, miRanda and Targetscan), number of experimentally validated targets (miRTarBase) of significantly differentially regulated miRNAs. The number in bracket indicates the no. of unique genes.
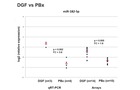
qRT-PCR validation of the most significantly differentially regulated miRNAs between DGF and control group (PBx). Log2 (relative expression) values are shown for the qRT-PCR and the array experiment. The red line indicates the median.
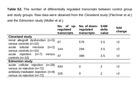
The number of differentially regulated transcripts between control group and study groups. Raw data were obtained from the Cleveland study (Flechner et al.) and the Edmonton study (Müller et al.).
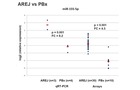
qRT-PCR validation of the most significantly differentially regulated miRNAs between AREJ and control group (PBx). Log2 (relative expression) values are shown for the qRT-PCR and the array experiment. The red line indicates the median.
Pathway enrichment analysis of the validation data set from Edmonton. Enriched pathways in the predicted and validated miRNA target lists in AREJ or ABMR and differentially regulated transcript lists are represented.
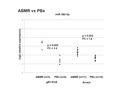
qRT-PCR validation of the most significantly differentially regulated miRNAs between ABMR and control group (PBx) or of miRNAs being also differentially regulated in other groups. Log2 (relative expression) values are shown for the qRT-PCR and the array experiment. The red line indicates the median.