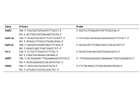
Primers and Probes used. List of sequences of primers and probes used in these study.
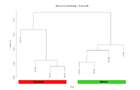
Unsupervised hierarchical clustering. Unsupervised hierarchical clustering, 21131 transcripts, sirolimus treatment day 7 (pearson correlation, complete linkage)
Summary of major results.
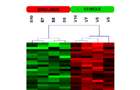
Dendrogram of gene expression profiles. Dendrogram derived by unsupervised hierarchical clustering of gene expression profiles characterizing the sirolimus group (red bar) and the vehicle group (green bar). Red spots ndicate up-regulated transcripts, whereas green spots indicate down-regulated transcripts relative to the other group.
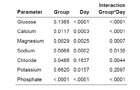
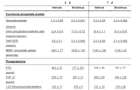
a: Effect of Sirolimus on electrolyte concentration in the urine. P-values of mixed linear models of Glucose, Calcium, Magensium, Sodium, Chloride, Potassium and Phosphate in the Urine. Group refers to the sirolimus effect, day refers to the time effect over seven days and interaction describes effect modification. With the exception of magnesium and sodium, no adjusted group effect could be observed.
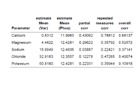
b: Correlation of urinary electrolyte concentration with phosphate in the urine. Correlation coefficients (corr) of calcium, magnesium, sodium, chloride and potassium (Var) to phosphate (phos) in the Urine. Only calcium showed a somewhat stronger correlation with urinary phosphate excretion.
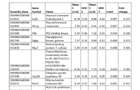
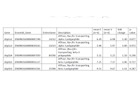
Significant differentially expressed genes between sirolimus (S) and vehicle (V) treatment listed by fold change.
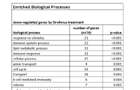
Functional classification of DEGs using PANTHER ontologies. Enriched biological processes separating sirolimus from vehicle group as derived on the level of differential gene expression by SAM. Categories are ranked by the p-value (comparison of expected number of genes and observed number of genes in each biological process) indicating the relevance of a particular process.
Na+/K+ -ATPase subunits expression levels between sirolimus and vehicle group measured on the GeneChip expression array. None of the polypeptides forming Na+/K+ -ATPases are differentially expressed between the groups.