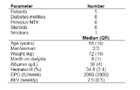
Demographic data of PD-patients. Data are represented as counts or median and full range.
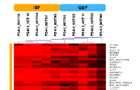
The dendrogram derived by unsupervised hierarchical clustering of differentially expressed genes comparing IBF and GBF treatment (PD: Peritoneal dialysis, I-V: patient ID, 1: IBF, 2: GBF, microarray label). The Pearson correlation and complete linkage were used as distance measure and linkage rule in the hierarchical cluster algorithm. Red spots indicate abundantly expressed transcripts, whereas green spots indicate transcripts expressed on low level when compared to the reference RNA.
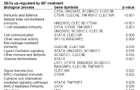
Biological processes separating IBF and GBF treated patient groups as derived on the level of PBMC differential gene expression. Categories are ranked by the p-value indicating the relevance of a particular process.
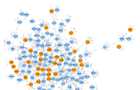
Largest protein-protein interaction subgraph derived on the basis of differentially regulated genes with a fold change over 1.5, respectively. Blue nodes (98 DEGs) indicate up-regulated genes by GBF treatment and orange nodes (34 DEGs) up-regulated genes by IBF treatment. Gray nodes represent proteins identified by the nearest neighbour expansion method.
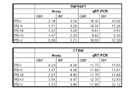
Log2 (relative expression) in the microarray and qRT-PCR experiment of five patients (PD-I PD-V) after glucose based fluid (GBF) or icodextrin based fluid (IBF) peritoneal dialysis treatment.
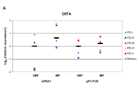
qRT-PCR validation of four selected genes (CIITA, TNFRSF7, CTSW, CLEC1B): The log2 (relative expression) measured in the microarray and in the realtime RT-PCR (TaqMan assays) experiment of five PD patient (PD-I PD-V) and their median is shown. Median log2 (relative expression) after the glucose based fluid (GBF) peritoneal dialysis treatment in the microarray and qRT-PCR experiment was set to zero allowing to compare the relative differences to the icodextrin based fluid (IBF) treatment in both experiments in one figure. All genes (A-D) are up-regulated by IBF in both methods although the up-regulation is less in the validation experiment.
Red lines represent the models computed with data missing, black lines represent the hazard ratio and 95 % confidence interval when missing data are replaced.