Bodyweight and blood creatinine of the rats

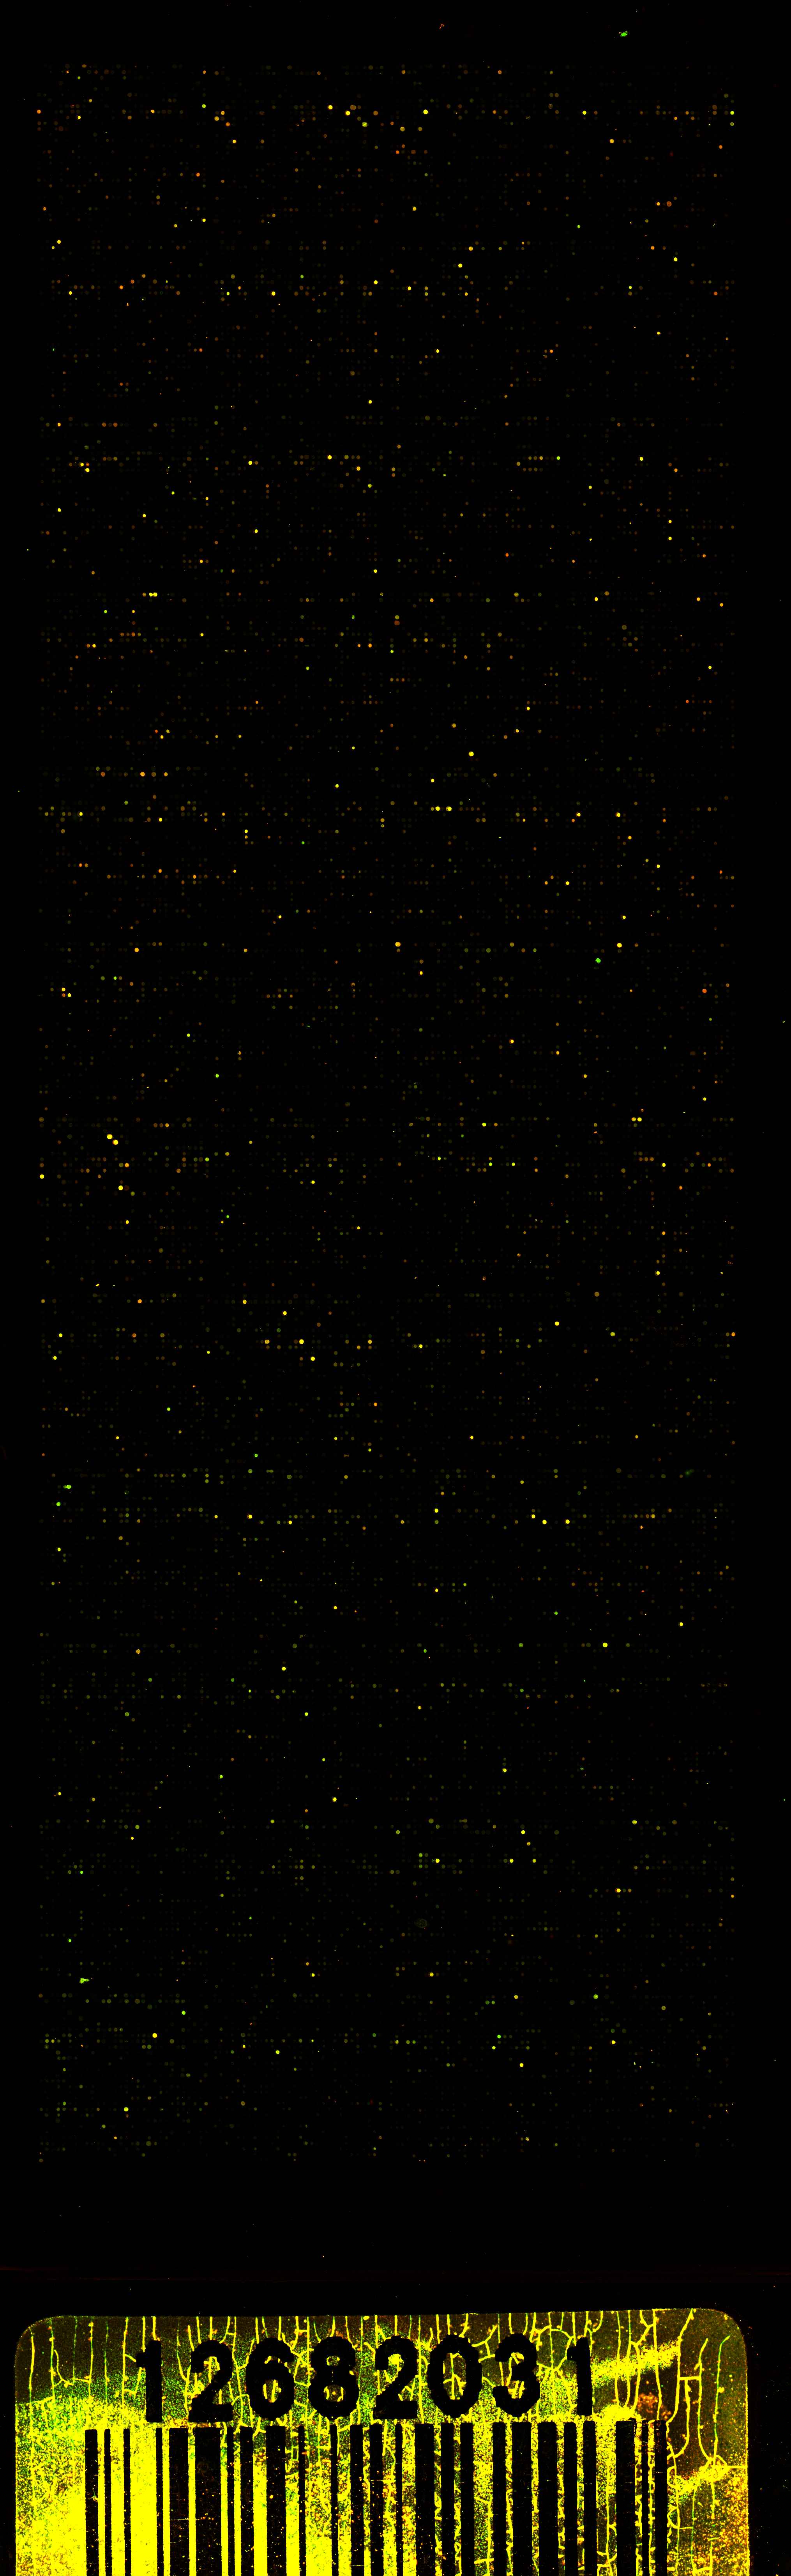
Expression profiles of differentially regulated genes at three time points (12, 24 and 72 hours) between UUO and UN. Green colour represents suppressed genes/sequences compared to control and red colour abundantly expressed features over control. The unsupervised hierarchical cluster algorithm groups kidneys according to the similarity in their molecular signature next to each other (#1 to 3). UN kidneys from the same time point as well as UUO kidneys from the same time group nicely together. Shaded areas in the heat map represent other time points as the time indicated on the left.
Functional roles of differentially regulated genes between UUO and UN
vs. control at all three time points 12, 24, and 72 hours. The majority
of transcripts were suppressed in UUO and UN compared to control. Suppressed
sequences are labelled in green, upregulated features are marked in red.
Numbers are log2 of expression values.

Expression profiles of more than twofold differentially regulated genes between UUO and UN. Green colour represents suppressed genes/sequences compared to control and red colour abundantly expressed features over control.
Twofold or 0.5-fold differential regulation of genes in UUO vs. UN. All differences achieve a p value of <0.001, no adjustment for multiple testing was performed. Numbers are log2 of expression values, red colour indicates abundant expression green colour suppression in UUO and UN.

Network graph depicting the seven transcription factors and the genes with ginding sites in their regulatory regions. Transcription factors are in oval boxes whereas genes are in square boxes. Color coding depicts the three different transcription factor class, namely basic leucine zippers (bZIP), forkhead, and the TRP-Cluster.
Number of differential regulated genes compared to reference. In the tables linked by webtable 1 the expression values are log2-values, red colour indicates abundant expression green colour suppression in UUO and UN.
Number of differential regulated genes between UUO and UN. In the tables linked by webtable 1 the expression values are log2-values, red colour indicates abundant expression green colour suppression in UUO and UN.
Listing of the transcription factors (TF) with a significant number of binding sites in the gene set of upregulated genes in the UUO group compared to the UN group. Significance was determined using the fisher exact test between the target hits/non-hits and the hits/non-hits of the reference dataset. Clones for three transcription factors were spotted on the array.