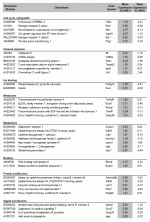
Representation of the 62 genes upregulated in the TOL group compared to the CTRL group. Genes are categorized based on GO Terms and PANTHER classifications and are ranked by difference of mean expression between the two groups studied.

Expression profiles of differentially regulated genes between the TOL and the CTRL group. Euclidean distance was used as distance measure and complete linkage as the linkage rule. Red spots indicate abundantly expressed transcripts whereas green spots indicate low expressed transcripts in comparison to the reference RNA. A clear separation between the two groups is detected. GenBank accession numbers and Gene Symbols are used for labeling the cDNA clones. Genes upregulated in the TOL groups are depicted on the left whereas genes downregulated in the TOL group as compared to the CTRL group are shown on the right.
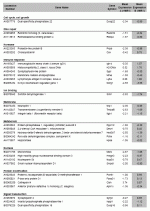
Representation of the 51 genes downregulated in the TOL group compared to the CTRL group. Genes are categorized based on GO Terms and PANTHER classifications and are ranked by difference of mean expression between the two groups studied.

Inflammation mediated by chemokine and cytokine signaling pathway. Genes highly upregulated in the lymphocyte populations in our dataset are highlighted red.
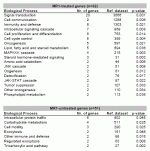
Biological processes statistically enriched with differentially expressed genes between the TOL and the CTRL group. The reference dataset consisted of all 23,520 genes with assigned biological processes. Categories are sorted in descending order by the total number of genes in each group.

Transcription factors with enriched binding sites in the regulatory regions of the genes upregulated in the TOL group compared to the CTRL group. The reference dataset consisted of 200 randomly picked promoter sequences as provided by the CONFAC tool.
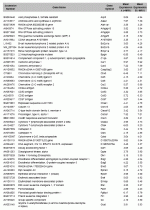
Genes (n=168) abundantly expressed (fold change > 3) in both groups compared to the mouse reference RNA. Genes are sorted in alphabetical order by Gene Symbol.
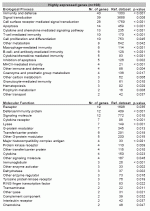
Biological processes and molecular functions with a statistically enriched set of abundantly expressed genes assigned to. The reference dataset consisted of all 23,520 genes with either an assigned biological process or molecular function respectively.
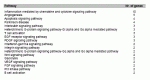
Biological pathways the abundantly expressed genes are involved in as reported by the PANTHER classification system.