Supplemental data to: Am J Transplant

Donor characteristics
View PDF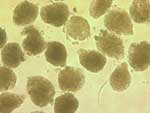
Manually microdissected unstained glomeruli from a wedge transplant kidney biopsy (print magnification 200x)
View JPG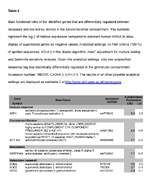
Significant features. TI CAD vs LIV (p<0.05)
View PDF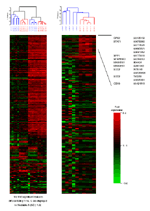
Unsupervised hierarchical clustering of LIV vs CAD microdissected glomeruli and tubuli.
View PDF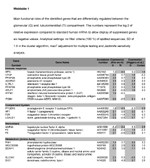
Significant genes separating TI from G (SD >1.6)
View PDF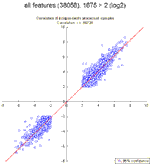
Correlation between independently processed samples (from RNA isolation to array readout) from the same biopsy specimen using either all features or only those that were more than 0.3 SDs differentially regulated on all arrays.
View PDF
Number of features using seven different SDs (ranging from 0.8 to 2.0) and the 80 % filter (sequences needed to be present in at least 80 % of all arrays) or unfiltered data.
View PDF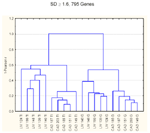
Dendrograms similar to figure 2 but with different SDs of >1.0 and >1.6.
View PDF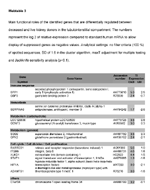
Functional roles differentiating CAD from LIV in TI (p<0.1)
View PDF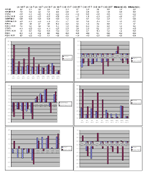
Dendrograms similar to figure 2 but with different SDs of >1.0 and >1.6.
View PDF
Number of putative consensus transcription factor binding sites (matrices) found in the 62 upstream sequences (500 bp) separating TI from G.
View PDF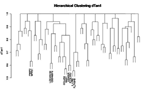
Dendrograms similar to figure 2 but with different SDs of >1.0 and >1.6.
View JPG
Original data according to the MIAME guidelines:
View PDFArray experiment:
CAD 149 G // CAD 149 G.jpg // CAD 149 G.zip
CAD 149 T // CAD 149 T.jpg // CAD 149 T.zip
CAD 151 G // CAD 151 G.jpg // CAD 151 G.zip
CAD 151 T // CAD 151 T.jpg // CAD 151 T.zip
CAD 185 G // CAD 185 G.jpg // CAD 185 G.zip
CAD 185 T // CAD 185 T.jpg // CAD 185 T.zip
CAD 187 G // CAD 187 G.jpg // CAD 187 G.zip
CAD 187 T // CAD 187 T.jpg // CAD 187 T.zip
CAD 203 G // CAD 203 G.jpg // CAD 203 G.zip
CAD 203 T // CAD 203 T.jpg // CAD 203 T.zip

